 Get The Book
Taking Baby Steps with Node.js – Debugging with node-inspector
January 14, 2011Here are the links to the previous installments:
Writing unit tests for your code drastically reduces the amount of debugging. This is the case for practically any programming language that you work in. But when the shit hits the fan, having a debugger with some decent features at your disposal is a must. However Node.js doesn’t come with a debugger out of the box. Thankfully there are a couple of debuggers out there like ndb, node-debug and node-inspector, which I’ll going to be demonstrating in this blog post. For this blog I’m going to show you some of the nice capabilities of node-inspector.
Installing node-inspector is actually pretty easy when you have npm installed. Just issue the following command:
npm install node-inspector
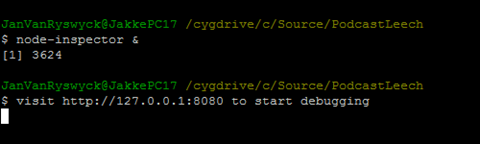
Now we can startup node-inspector …
node-inspector &
which shows the following output if all goes well:
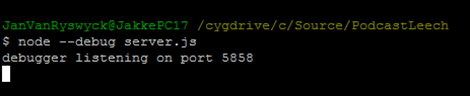
Now that we have node-inspector running, we can start debugging our node.js application in another console:
node –debug server.js
which outputs the port on which the debugger is listening.
Now you can open Chrome and point it to the following URL:
http://127.0.0.1:8080/
If all goes well, then we’ll get to see some JavaScript source code:
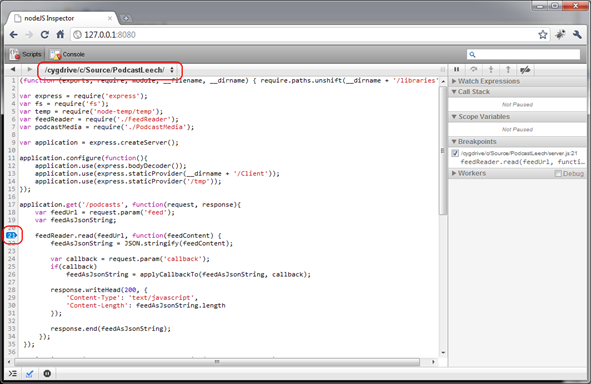
Note that you’ll have to use Chrome or another WebKit based browser for opening node-inspector. I also tried it in Firefox, but the page doesn’t show at all.
You can then select the JavaScript source file that contains the code you wish to debug and add breakpoints like you would normally do in an IDE like Visual Studio.
Now we can start using our application until we hit a breakpoint.
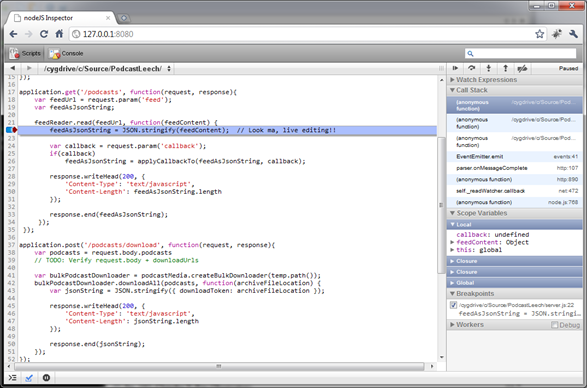
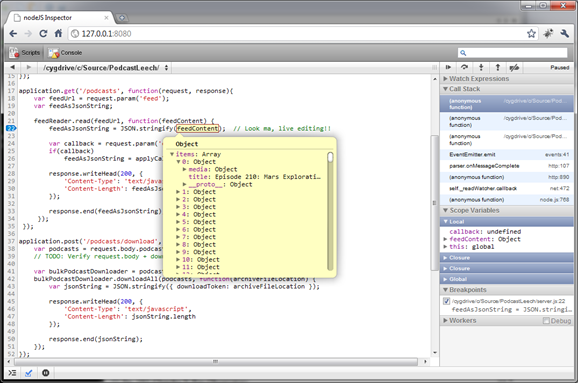
On the right of the page we can add watch expressions, look at the call stack and the current values of the scope variables. In the code window we have the usual suspects like “Step over”, “Step into next function” and “Step out of current function”. We can even do live editing and all of this right in the browser! Tooltips also work as expected.
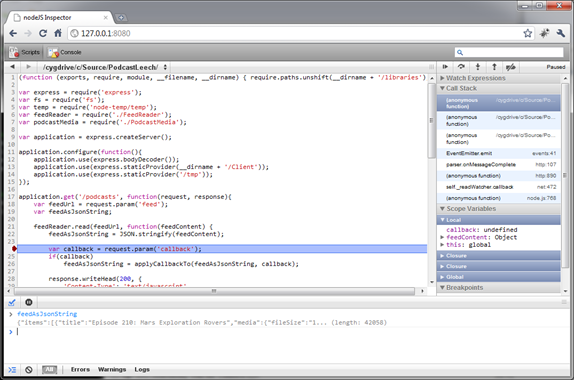
Another nice feature is the console window that can be shown/hidden below or taking over the entire window by clicking the menu button at the top of the page.
Because I’ve been using version 0.2.3 for developing my very first application using Node.js, I had to install an older version of node-inspector. If you decide to use the latest version of Node.js, you will see that a couple of interesting new features have been added, like heap snapshots. Make sure to watch this short screen cast to get up and running in no time with node-inspector.
Using node-inspector while developing Node.js applications can really save you a lot of grief. It certainly helped me to find a couple of bugs that would otherwise be hard to track down. It’s also a great learning tool if you would like to learn more about how Node.js behaves at runtime.
Until next time.
If you and your team want to learn more about how to write maintainable unit tests and get the most out of TDD practices, make sure to have look at my trainings and workshops or check out the books section. Feel free to reach out at info@principal-it.be.

Jan Van Ryswyck
Thank you for visiting my blog. I’m a professional software developer since Y2K. A blogger since Y2K+5. Author of Writing Maintainable Unit Tests. Teaching and coaching XP / Lean practices. Speaker at tech conferences. Curator of the Awesome Talks list. Thinking and learning about all kinds of technologies since forever.
Comments
Get The Book

Writing Maintainable
Unit Tests
Watch The Videos
Latest articles
-
The Saff Squeeze
June 10, 2026
-
Fixing vs Preventing Defects
March 12, 2026
-
Tales Of TDD: One Test Double To Rule Them All
March 5, 2026
-
Perspectives On Software Quality
February 3, 2026
-
The Five Underplayed Premises Of TDD
August 8, 2025
Tags
- .NET
- ALT.NET
- ASP.NET
- Agile
- Announcement
- Architecture
- Behavior-Driven Development
- C++
- CQRS
- Clojure
- CoffeeScript
- Community
- Concurrent Programming
- Conferences
- Continuous Integration
- Core Skills
- CouchDB
- Database
- Design Patterns
- Domain-Driven Design
- Event Sourcing
- F#
- Fluent Interfaces
- Functional Programming
- Hacking
- Humor
- Java
- JavaScript
- Linux
- Microsoft
- NHibernate
- NoSQL
- Node.js
- Object-Relational Mapping
- Open Source
- Reading
- Ruby
- Software Design
- Software Quality
- SourceControl
- Test-Driven Development
- Testing
- Tools
- Visual Studio
- Web
- Windows
Disclaimer
The opinions expressed on this blog are my own personal opinions. These do NOT represent anyone else’s view on the world in any way whatsoever.
About
Thank you for visiting my website. I’m a professional software developer since Y2K. A blogger since Y2K+5. Author of Writing Maintainable Unit Tests. Teaching and coaching XP / Lean practices. Speaker at tech conferences. Curator of the Awesome Talks list. Thinking and learning about all kinds of technologies since forever.
Latest articles
The Saff Squeeze
June 10, 2026
Fixing vs Preventing Defects
March 12, 2026
Tales Of TDD: One Test Double To Rule Them All
March 5, 2026
Perspectives On Software Quality
February 3, 2026
Contact information
(+32) 496 38 00 82
info@principal-it.be